The month ahead: September 2007
September! A new month, new opportunities and finally we are done with the summer. Liquidity is back! So let's look what september has in store for us.
Fundamental point of view:
With the ongoing liquidity crisis, the market market is very hedgy and looking at the Fed for a direction to shoot. At first sight, the easy answer is buy, but this might not be that true. First if economic data gets out on the strong side, this could reassure the market and send it lower.
Secondly, the Fed could succeed in calming the market and bringing back some liquidity to the market. This last hypothesis holds if the crisis does not deepen. Finally the crisis could also disappear by itself but this case holds maybe more from fantasy than reality. Signs that the market is coming back to normal would be a lower Libor fixing and a disinversion of the swap spread curve. Signs that the crisis is deepning and transforming itself in a full blown credit crisis will be quite evident I think.
Needless to say that this month's economic data will be very important and could be a catalyst for the direction the T-bond will follow.
Seasonal/statistical point of view:
Looking at the performance of the T-bond over the last 10 years, we can see that it usually gains a bit more than a buck, but the interesting point here is that the T-bond don't move much until the 12th. Although this year with the current instability it could be a bit more rocky....
Looking at our home-made elasticity index we see there is no indication here. We are in the middle of the range and so we do not have any preference for direction with that indicator...
Technical point of view:
On the technical side there is much to talk... So let's start and look at the downside. I have much talked about the 112 line which was a resistance that was first tested in April/May 07, but it is also on a descending trend line started at the begining of June 05... So this is a pretty big point. If we overpass it, we're are climbing high. Otherwise we are going back down with a first stop around 110-00.
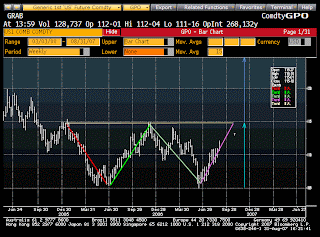
Now let's look at the other side of the coin. If we take a weekly chart, you could notice that the market has been in a double bottom formation for the past year and a half. If we valid the formation, we could visit the low 120s.... Here is the chart below....
Conclusion:
If we resume ourselves, on the fundamental side, you might prefer to be long than short with the current event. On the statistical side, nothing really conclusive but on a seasonal basis the market usually goes up by a buck. Finally, from the technical point of view the market has good reasons to go either way but with the mounting evidences from the previous two points we might prefer the double bottom scenario...


No comments:
Post a Comment