9/30/2007

The month ahead: October 2007

Fundamental view:
The market is very nervous right now and does not know where to go. On one hand, we have a possible economic recession looming around the corner while on the other hand, we have market participants selling US debt because: 1- Possible long term inflation problems and 2- Foreigners dumping US debt in favor of Euro denominated debt and others.

This clash between the two views gives us relatively low daily volatility but very high intraday volatility as we have seen in the last week. This month data will be very important to help us figure out where growth is going and also where is inflation going. Right now, inflation seems to be marginally leveling off while growth is still there. In fact, looking to all of this more closely, it is only NFP and consumer spending that are affected... But they usually precede more serious troubles, so we will be looking for some confirmation in October's data.

Also, last point to check on our fundamental checklist is our liquidity/credit crisis. In apparence, things seems to be getting better but the market is still pretty tight. We still have a lot of bad news coming out of Europe while in North America, we just keep falling lower and lower in the home sector. Another sign that the market is pretty tight right now was the Libor that had a little run-up last week as people were scrambling for cash for the end of month and quarter picture...

Seasonal/statistical point of view:
October has a slight negative bias if we look back over 10 years, but over the last 5 years, the answer is very clear: Go short.

Looking now at our elasticity index, there is again nothing new there. Like in September, the index is standing right in the middle of its range stating the T-Bond is fairly evaluated compared to other assets and nothing interesting can be done over weekly/monthly horizons. Looking at it on a daily basis does not give more solace as no signals were clearly identified. The closest thing we had to a real signal was a partial alert to sell at the close on September 11. Looking back this would have been a great trade, but no official signal = no trade = no money... Too bad.

Technical point of view:
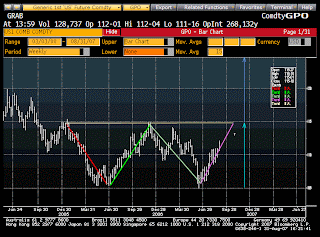
Looking back to what we had predicted for September we see that we opened the month with the bullish scenario but failed to break out of the top at 114-23. If we had broken it, we would have confirmed an almost 2 years double bottom and opened the door too much higher prices. In the end, the downward resitance line kicked back into play after being violated and we went straight for the first support at 110 where we held and bounced higher afterwards.

October is the first of a sery of tricky month because usually they lack a clear trend... They will drop like like a rock and from no where zip back-up in the blink of an eye rendering trend following very hard. So the play in those autumnal months is to play support and resistance.

Support levels to look at: 110-00 (Tested in September)
108-20 area
105-14

Resistance levels to look at: 112-00 (Tested on Friday)
113-15
114-25

The option corner

Options are expensive right now. That being said opportunities are still around for people who like to be long vega. On september 20th we had a signal from our breakout model to buy straddles and they were sold back this morning while the market was at 111-21 for a small profit.

The actual context seems a bit tough for volatility buyers since daily moves are very small, but opportunities are present since we have huge intraday vol. Just think of today where the market closed unchanged on a daily basis but had a range of over 1 buck for the day. Taking all of this in consideration, market participants who want to buy vega must be careful of where they pick their spot and look throughout the day for sell points.

October is starting Monday and iron butterflies are expansive, as you might have guessed! In fact, prices for them haven't been that high since 2005... Just before the close of Friday, you could buy iron butterflies for around 88/64 where as lately the price is more around 78/64... One thing not to forget is that we have slightly more days this month that the norm so this also helps to bump the price a bit.

T-Bond trading comment (September 28, 2007)


Few, what a day we had ! We opened this morning on the upside, licking the
112 level and boom in the afternoon we went as low as 110-26 before recovering to the 111-11 level which was the opening price! The daily movement does not give a fair idea of the intraday movements... This morning we ticked higher on the back of continued fears about the economy and month end. We had several economic indicators in the morning but they all came around their expected values and did not create any major turbulence. After the news we started to drift slowly lower and we were looking to close the day around 111-22 but that was not to happen.

In the early afternoon, the US Dollar started to weaken against most currencies and started to spiral down prettty fast. Since the US basket and the Bonds are positively correlated, the bond just started to puke on volume. People were dumping treasuries on the fact that if US is getting dumped, that means that foreigners are probably selling their investment and you don't want to be left holding the poop bag alone. The slide was maybe a bit exagerated and we started to win back part of the loss. We closed the day unchanged... Again... We've had a lot of compression days lately, when the market is going to move one way or the other it might be very abrupt.

Next week is the first week of October, so this means that we have NFP! In addition to that we of course have ADP, but also the ISM indexes and pending home sales. Also with the rumour mill spinning like crazy we might get some added volatility. The last one I heard today was that the BOE was going to have an emergency meeting to cut rates....

9/25/2007

T-Bond trading comment (September 25, 2007)

We broke overnight the 111-00 resistance we had been toying with for the past few days but closed below it on steepner trades ! We opened higher this morning and broke through the 111-00 resistance overnight while Germany had disappointing economic numbers and the rest of the world was fretting about increased risk about the slowing of the economy. After that the T-bond started to slip as well as the rest of fixed income as equities were opening on a strong foot. The T-Bond fell more than its fair share, even breaking its new 111-00 support as people are still rooting for a more pronounced economic slowdown and thus a steepning of the curve. Sell the long end and buy the short end.

Right now, the feeling in the market is very mixed. Traders are trying to balance in their mind and their book two fears. On one hand we have inflation risks that are increasing with higher oil prices, lower Fed rates and China's overheated economy and on the other hand we have economic slowdown... Which one is the most probable and the scariest? This is the question a lot of the street is asking.

9/24/2007

Looking at the options

Right now, trying to profit from the actual instability through an ATM straddle is pretty expensive. Friday morning it was running at about 140/64. Today this is a bit better but nothing to call your grand mother.

So you might just want to wait until the beginning of October, next Monday, to put on iron
butterflies. These butterflies performed in a stellar way, especially if you sold the most expensive option on September 7th, bringing home a bit less than 2 bucks in. Altough, past performance is no indication for the future and this is especially true for October. Looking at the two preceding years, October has always been a rough month for these strategies....

T-Bond trading comment (September 24, 2007)

We are about flat on the day, but this is not a fair description of the day. We arrived this morning at the office with the T-Bond loosing half a buck overnight. As soon as everybody was fully seated at their desk, we started to run higher as market participants had increased fear of an economic slowdown in the US. In accordance to that, equities were hit, thus rejecting for now, higher highs . It is worth noting that we have been in this dynamic since early June 07. Bear, here we come ???

We are slightly up for the day, but we still haven't validated a bullish configuration. As long as we are at the 111/111-04 level, we will be in a corrective move.

Today we didn't have any economic news, but tomorrow we are up for S&P/CS index (loss expected here), Richmond Fed Index (another loss there too) and home sales ( guess what? another loss too!). If the news come out on the weak side we might very well end our corrective move.

9/23/2007

The week ahead

Next week will be rather calm in terms of economic news. Wednesday, we have durable good orders and Thursday, we have GDP. Both these numbers will be looked at in an attempt to define how much is the economy slowing. Is it a recession slowdown or just a little pause slowing?

Also next Friday is the last day of the month, so we could see some buying activity with index extension...

9/21/2007

T-Bond trading comment (September 21, 2007)

After a week of heavy selling, we saw some good short covering to close the week. The market opened on a strong foot in the early morning but met some resistance when Warsh talked about inflation. This quickly sent the market to yesterday's electronic closing at 110-01 but speculators were unable to break through it as some strong bids came in to lift the market. At that point buyers just clicked in and from there on we had some smooth sailing to the upside.

The question right now is: Was this just a slight short covering for the week-end before restarting to the downside next week or are we retracing a bigger part of the late downslide ? Right now, there is no reason to root for a bigger retracement as long as we haven't taken out the 111-00 level so this means it looks that there is more room to the downside.

Today was expiration day for options, people who bought there iron butterfly on the first day and sold the most expensive option of the butterfly on September 7 have cleared a hefty profit....

9/20/2007

T-Bond trading comment (September 20, 2007)


Well the post Fed bull run we had in equities came to an end today but that was not the end for our bear spell in the T-Bond as the market puked another buck and half. Players are just putting more and more steepners on and by doing so kill the long bond. An aggravating factor to this bleeding is several rumours churning around that Asian and Middle-East countries are looking to dump their US holdings. If this turns out to be true, the bleeding will become an hemorrhage.... The news first it the trading desks with the fact that Saudi Arabia might stop its peg to the US dollars. If they do that, the next logical step is to dump their US holdings... So this could become ugly...


Today, the only way to be was to be short. Just take about any point between 7h00 AM and 16h40 PM and you made money on the downside.... This was one of the rare days lately where the long bond and the equities had a strong positive correlation.


Now the question is where we are going from here ? The answer is not very easy. We are entering the autumn months and generally it is pretty hard to find lasting trends at that time of the year. 2006 was more of an exception than the norm. Technically, we are bearish but we have lost four bucks in two weeks so a little respite could also be possible especially since trends usually stop around this time of the year and the markets starts oscillating until mid January. My personal opinion would be to test the downside if you are not already short but most importantly put a at the money straddle with a momentum exit.... This couls yield potentially interesting results...

9/19/2007

T-Bond trading comment (September 19, 2007)

We confirmed the bearish strategy we outlined yesterday and that was simmering for the past week. Early last night, we opened below the 112-16 level and from there on, we just went lower. With equities on the strong side the market tanked more than a buck until 11h30. This is when equities stopped climbing and started to give some ground. From there, we partially reversed the loss on the T-bond but still, the long bond is bleeding lot more than its shorter comparses...

The reasons behind this fall are inflation and slowing economy according to me. We're just finished with inflation reports and yes they were not very scary at first look. But dig in deeper and what do we see? Inflation ramping up in food, medical services and services. This kind of inflation is harder to kill of than energy inflation and that is not good for a 30 years bond as you might expect. The second pressuring factor on the T-bond is the belief that the economy is going to slow and maybe enter in recession. This factor coupled to a Fed rate cut and you obtain curve steepning. How do you put a curve steepner? you sell the long end and buy the short one. In addition to these fundamental reasons we were also running out of steam on our bull summer bull run.

We do not have any other major economic release for the week. Friday is option maturity day so we might stick to the 112 figure which was where we were on the first trading day of september

9/18/2007

T-Bond trading comment (September 18, 2007)


Well the FOMC came and went and where are we standing at the bell ? Just over the 112-16 level... Granted we went to see much lower post FOMC, but this problem was only in the T-Bond. Notes went barely down before going much higher and firmly rejecting the breach of the 109-20/22 support. Now the only big news until the end of the week is the CPI tomorrow morning so this could smell foul for vega buyers as the options are expiring on Friday. The real question now, is were are we headed for the near future? The answer to this question may be lying on an intraday chart. If you look at a multiple intradays chart you will notice that we have a nice descending triangle. The horizontal line, forged by the lows, lies at 112-16 and the descending line is made by lower highs (114-02, 113-16, 113-06...). This picture is pretty compelling and indicates that we have more room to the downside than the upside...


We opened the market with, again, the exact same pattern as the last 4 days. We opened trying to challenge new highs and quickly failed before quickly retracing our steps towards the 112-16 level. From there on, we drifted higher like the other days. Altought this time we went lower as the market prepared itself for the Fed.

As you might have seen (duh !), the Fed lowered its rate by 50 bps, what the market was princing. Market participants are still haggling on the size of the cut. Certain people think the Fed had no reason to cut while others thought the opposite. Honestly, I do not care if they were right or not, the only thing I think about is that this move is inflationary... By the way, Greenspan thinks that our next big beast is long term inflation....

9/17/2007

T-Bond trading comment (September 17, 2007)


Very low volume in front of the Fed tomorrow. We had, as we might have expeected, a very uneventful day. Like we did on Thursday and Friday, we tested supports in the morning before bouncing up after failing on the 112-16 level. This level has to be put in parallel with the level of
109-20/22 on the T-note. If we break that, we are ending the bull run started inJune. Otherwise, we stay in our double bottom scenario we outlined in our September 1st post.

Like the last two days, we opened the market with some half hearted runs to the upside but each run was met with a wave of selling. This pattern broke off after the Empire Manufacturing Index. We went to see the 113 level on the number and then plunged towards the lows of 112-16. The descent was pretty much straighforward but the 112-16 held on very strong bidding. After that, we started to go higher on low volume. Now the next hurdle is in tomorrow afternoon. In the meantime people will want to flat their positions ( if they still have some!) before the FED. So don't expect much action until then.

Tomorrow in addition to the FED, we have PPI. On our radar, are also Q3 results from Wall Street in the US that starts off tomorrow... It will be interesting to look at them. People expect to see a quarter as bad as in 2001.... Lastly don't forget that this week is option expiration week.

9/15/2007

The week ahead

Next week, Monday and Friday are dead or almost! But that is about it. We have PPI/CPI numbers on Tuesay and Wednesday. These numbers will be important as we will see if inflation continues to dampen or not. In that line of thinking, there has been much talking about food inflation and Chinese inflation. Lots of people say that China does not says thruth about their inflation. If both of the preceding assumptions turns out to be true (higher food and Chinese inflation) we could see the market tumble by a fair amount.

But lets not fret about such rubbish for now, because all this is dwarfed by tueday's FOMC rate decision. A cut is more than widely accepted but much talking and hagglingis going on about the size of the cut. 25 or 50 bps . Right now, market probabilities are slightly in favor of the 50 bps cut (46.4% against 45.7%). Another interesting possibility would be a 25bps cut in the overnight rate but a 50 bps cut in the discount rate. This might be a very effective way to lower the Libor without lowering the overnight rate by too much.

9/14/2007

T-Bond trading comment (September 14, 2007)


Again we tested higher levels and again we failed and went lower to try important support levels witout breaking them decisively. We opened to the upside this morning on bad news from Europe. Stocks were getting hit after Northern Rock announced it had liquidity problems. This pushed the T-Bonds higher toward the 113 line. 8h30, the durable good orders came out on the weat side and propulsed the market higher still. We were going for the 113-17 level on which we failed yesterday, but before arriving there UoM came out as expected and the equities decided there was no more credit crisis for the time bieng and shot upward. This killed our little rally in the blink of an eye. In 45 minutes we lost almost a buck to come and sit on yesterday's support just below 112-2. After that, the market got stuck between 112-16/22 on low volumes and looked like it was going to stay there, but the market initiated a little rally for the 3 o'clock close and went to 112-27. A possible explanation for this, is market participants covering their shorts for the week-end in case any bad happens.


The credit/liquidity crisi is looking a bit beter right now. Countrywide got more financing, GMAC too. Market participants are depricing risk which sends credit and stocks indexes back to more normal bahaviors and Libor is coming back. That is all well, but I find myself surprised to hear everybody around me saying this is merely the calm before the hurricane... Guess we will see.


By the way did you look at a S&P500 chart lately?

9/12/2007

T-Bond trading comment (September 12, 2007)

We are in a trading range ! This morning we tried the upside of the zone and we failed to overpass the 114-5 area. From there on, we traced lower while stocks were going higher and several market players were cashing in on long positions. The fall was pretty straightforward with a little battle around 113-20/22 (yesterday's support area). We went all the way down to the support we designed on Monday morning at 113-8/10. After that we were getting late in the morning and liquidity died out while we kept bouncing off the support area.

Mid trend followers had another nice day after yesterday as the market gave very clear bearish signal. Talking about that, the best time of the year to do this kind of trading is in the second part of the year and 2007 is no exception to this rule. Of course for this to work, you wait for the liquidity to come back after the summer!

If the 113-10 level holds, these last two days could very well be a little breather before going higher. Otherwise, the huge bull run we started around 106-20 is coming to an end... We must not forget that the usual summer run generally dies out at the end of September/ beginning of October, when we have one.

Tomorrow, we have claims, 10y reopening and the montlhy budget statement at 2.

9/11/2007

T-Bond trading comment (September 11, 2007)


We had a breathing day today, after two days of heavy trading to the upside. Liquidity was not very good all day. We opened this morning with bearish intentions but this was quashed at 113-21 (This level would actually turn out to be a support for the rest of the day). Afterwards, we drifted aimlessly while waiting for Bernanke. His speech had a bullish impact on the market but he basically just repeated what has already been said for the last few weeks. Like yesterday, the upswing got stuffed at 114-05. From there on, we started to go lower on very low volume. Again we touched the 113-21 level before bouncing back up to the 113-27 area.

The behavior of the T-Bond has been a bit peculiar over the last two days.... It is as if some heavy curve flatners were put on and the market rather well supported in comparison of the T-Notes 5 and 10y. The problem is that we are not hearing anything about curve flatners being put on. Another alley is that pension funds are buying longs bonds to match their maturity and getting the hell out of riskier investment while the loss is not too nasty.

On the news front, we had a rather ok day. Equities in Europe and Asia showed healthy gains and the US followed the same path when it was its turn to play. Credit indexes (Itraxx and CDX) stayed flat to a bit tighter and the Libor tightened again ! We will see if the market can sustain good news/momentum for two days in a row...

Talking about the current liquidity crisis, we just brushed the positive side of the picture so let's dwell a bit on the darker side to be fair. On the negative side, we still have serious problems inthe commercial paper market (ABCP included). It is rumoured that up to 700 bln comes to maturity this week. This could put a lot of pressure on the Libor as well as on the balance sheets of banks that could find themselves in the obligation of taking some off the balance sheet items on their balance sheet... Hello funding/lending activities. The Libor US might be fixing lower but have you looked at the Libor CAD ? Not pretty. Finally, housing sectors is still underpressure with Countrywide rumoured to be in need of more cash after Bank of America's infusion. In addition to that, we had our first subprime casualty in the UK where Victoria Mortgage announced it is going into administration. If the subprime crisis transports itself to Europe, it could get really nasty...

By the way, our elasticity index seems to be getting a bit overextended so it would not be surprising to see the T-bond head lower... But let's wait and see for now...

9/10/2007

T-Bond trading comment (September 10, 2007)


We had a bit of job left to the upside after friday's bull rally and we did it today! We are now at the top of the 113-16 / 114 resistance zone and looking like wanting to take a breather after 2 bucks in 2 days. On the upside, the next big zone is the 114-20 / 115 area. If we break this, we validate a double bottom configuration with an ultimate potential around 124. We opened the day about flat compared to Friday's evening and from there we started to bid the market. Trend followers will have had a nice day as the market broke very nicely. Short gamma players, will have ran all day to hedge their books as well as market makers since it was a one way street.

People are running scared right now and are not necessarily logical.The market is like a herd of mad cows not thinking and moving all in the same direction. People are fearing a full blown recession after friday's weak NFP, but it is maybe a bit early to be that gloomy.

The rest of the week will be quite ligth in terms of economic numbers with only retail sales and import prices on Friday.

9/07/2007

T-Bond trading comment (September 07, 2007)


With today's NFP, we confirmed the bullish scenario for September with a 1+$ jump. We opened this morning with a slight upward pressure after holding the 112 support line yesterday. Liquidity was non-existant until 8h31 as the market was waiting for the NFP. Just before the NFP, the market got lifted for a couple of hundreds. Right after the number came out at -4 k. Instantly, we were almost a buck higher. Peoples with an explosion position waiting in their tradebook were rewarded. With the market pricing a rate cut for September 18th, we climbed higher & higher for the rest of the day.


Speaking of the Fed, if they cut the rates at their next meeting, they will be the only ones to do so. BoC, BOE and ECB all stayed put when their turn came by.


The market may be getting a bit ahead of himself right now. Why? If we dig a bit in today's number, you will notice that the major (if not almost all) part of the loss came from the teenager segment. The most probable hypothesis to explain that is not massive firing of incompetent youth ( we would have heard of it) but simply normal blokes heading back to school spend their hard earned summer bucks. If this turns out to be true, the market could come back in the next weeks.


In that line of thoughts, for the ones of you who bought iron butterflies at the beginning of the month should maybe looking at selling their 112 october call. Why? Do your own homework!

Good week-end

9/06/2007

T-Bond trading comment (September 06, 2007)


Yesterday, we put our bull hat and today we had our bear outfits.... Lately the market has been totally unsure of which way to go... We are oscillating between 110 and 112. Volatility buyers are bleeding while the sellers have been feasting for the past month. Even if the volatility has been huge on an intraday basis, we are not moving on a daily basis.

We opened the day virtually unchanged compared to the preceding close. After testing lows overnight, the market bounced up and actually looked like it was going to make new highs, but pretty soon it became clear that the 112-10/11 was going to contain at least for now bullish advances. At 8h30, we had claims, unit labor cost and productivity. The data was maybe a bit on the bullish side but after a small dip, we again tried to take out the preceding highs but failed. Market players though, if we can't go to the upside let's try the downside ! But bids were waiting in the corner and they came out at 112-01 and eventually moved to 03, 05 and 07. Again we failed to the upside and during lunch time, the formerly big bids were shot dead in seven minutes on 16k traded. After that the market died out and we broke the 112 line before coming back and hugging it for the end of day picture.

A point to keep in mind is that even if we have crossed to the upside the 112 line on the T-bond, the resistance area on the T-note hasn't been broken... Since both market are inter-related, we should keep a sharp eye on that. The resistance area is the 109-20/110-00 zone.

Tomorrow, we have NFP data!!! The ADP index was a bit low, but the correlation between both indexes has not been terrific up to date. All the economic numbers have been on the strong side lately, we will see if the trend continue tomorrow.

9/05/2007

9/04/2007

T-Bond trading comment (September 04, 2007)


First day of September and I don't think everybody was back... We had a relatively low liquidity market and small volume throughout the day. I remember at one point this morning just before 11h00, the market was only 6000 by 6500 which is a bit small. Even if the market went down like crazy this morning we remained almost unchanged compared to the settle of Friday. We are only down 3/32 on the day.

We opened this morning with some ambitions of testing the 112 line. We failed again at 111-29. Each time we fail, we inrease the probability that this resistance will hold in the future so we must keep in mind our bearish monthly scenario. After this unsuccesful challenge the market started to nose dive, we lost 20 ticks in the space of 90 minutes. At one point I tought we were going for one big point but in the end we settled for much less. This movement was spurred by strong equity markets as well as a sense that we are not yet deep in troubles. Just before 11h00 we encountered some aggressive bidding and a small base formed around 111-07/08. With the RSI hyper-compressed and stock markets starting to stall, we retraced part of the dive by succesive steps that continued for the rest of the day.

Tomorrow, we have the Beige Book as well as the ADP index and pending home sales. Home sales are not looking good but the ADP index is showing a healthy 80k survey. Also at 9h00, we will have the Bank of Canada rate decision. It will be interesting to see how they cope with the current market conditions.

9/01/2007

The month ahead: September 2007

September! A new month, new opportunities and finally we are done with the summer. Liquidity is back! So let's look what september has in store for us.


Fundamental point of view:
With the ongoing liquidity crisis, the market market is very hedgy and looking at the Fed for a direction to shoot. At first sight, the easy answer is buy, but this might not be that true. First if economic data gets out on the strong side, this could reassure the market and send it lower.

Secondly, the Fed could succeed in calming the market and bringing back some liquidity to the market. This last hypothesis holds if the crisis does not deepen. Finally the crisis could also disappear by itself but this case holds maybe more from fantasy than reality. Signs that the market is coming back to normal would be a lower Libor fixing and a disinversion of the swap spread curve. Signs that the crisis is deepning and transforming itself in a full blown credit crisis will be quite evident I think.

Needless to say that this month's economic data will be very important and could be a catalyst for the direction the T-bond will follow.


Seasonal/statistical point of view:
Looking at the performance of the T-bond over the last 10 years, we can see that it usually gains a bit more than a buck, but the interesting point here is that the T-bond don't move much until the 12th. Although this year with the current instability it could be a bit more rocky....


Looking at our home-made elasticity index we see there is no indication here. We are in the middle of the range and so we do not have any preference for direction with that indicator...


Technical point of view:
On the technical side there is much to talk... So let's start and look at the downside. I have much talked about the 112 line which was a resistance that was first tested in April/May 07, but it is also on a descending trend line started at the begining of June 05... So this is a pretty big point. If we overpass it, we're are climbing high. Otherwise we are going back down with a first stop around 110-00.


Now let's look at the other side of the coin. If we take a weekly chart, you could notice that the market has been in a double bottom formation for the past year and a half. If we valid the formation, we could visit the low 120s.... Here is the chart below....

Conclusion:
If we resume ourselves, on the fundamental side, you might prefer to be long than short with the current event. On the statistical side, nothing really conclusive but on a seasonal basis the market usually goes up by a buck. Finally, from the technical point of view the market has good reasons to go either way but with the mounting evidences from the previous two points we might prefer the double bottom scenario...
So buy bonds and were diamonds could very well be the motto for September !!!