12/20/2007

The end

Good evening,

This is the last post I will write on this blog as I have accepted a new position at the same bank but on another desk (Even another country in fact!). Interest rates will not be my focus anymore, hence the end of this blog.

To all the persons who wrote to me to share their views on the T-bond or support me, thank you!

That's the end for now!

Cheers

12/19/2007

12/17/2007

T-Bond trading comment (December 17, 2007)

I did not follow the market very closely today as I was stuck on an unexpected holiday due to a snow storm... But here are my thoughts about today as I was driving back towards home once the highways were cleaned.

Today, we saw the relief rally we talked about last Friday as the market was getting over-extended to the short side on strong inflation data and a depricing of the credit/liquidity crisis. Today, we saw both technical players, playing for a quick buck on a small rally, as well as more fundamental players getting hedgy about the liquidity in the market... Apparently, lots of people think that the FED's cash injection might not be enough... Also we had a flurry of new downgrades in the financial sector...

The question is, is there a lot more room to the upside on the T-Bond? Yes there could be, but right now lower prices could be seen in the very short term as the equities are due for a bit of a relief... They have been hit constantly in the last few days.

All that said, I remain very sceptical of where the price will go in the next few days... Our long position we had put on at Friday's settle was take-profited early this morning and for now we are flat... I will return back to scalping the market intra-day until more visibility comes up.

12/14/2007

T-Bond trading comment (December 14, 2007)

Not a good day... Did not respect the trading plan and got caught trading the wrong positions at the wrong time with the wrong size and blew the whole week's PnL in half an hour. Up to there, had a pretty good streak posting good stable PnL all week long but got ahead of myself this morning thinking I new better than the market... In the end, the market was right and I was wrong... Before I blew up more money, I pulled out the plug, suck on my losses and thought of why I did not respect the clear and simple rules I have established... The answer is I was too confident. There is a saying going around stating: "Don't worry the market will make you humble whether you want it or not". True.

Outside of that, CPI numbers got out on the strong side this morning and led to a sell-off (again) in the bond market... From there on we just oscillated in a 10 point range all day long with liquidity dying out as we where closing the week... The last two days have been a bit of a change as for once the bonds did not follow the opposite of stocks... Both ended down these last two days.

Looking at a weekly chart we see the drop has been very steep over two weeks in the T-bond... Sure we have a depricing of the credit/liquidity crisis and some strong inflation numbers but I think the market has maybe fallen a bit too hard lately and should maybe bounce a bit... From what I hear, I am not alone with that opinion... In any case our daily elasticity model gave us the go ahead to buy some long bonds at 3PM. Our target is 50 cents. Hope to see it sooner than later!

12/13/2007

T-Bond trading comment (December 13, 2007)


Another bearish day and we are almost back at the 114 line... It served as a resistance area in the past, so it should serve as a support this time... In addition to that the T-bond seems to be overstreched to the downside in relative value ... But there is one thing not to forget before being outright bullish and that is CPI... Today, we had very strong retail and PPI numbers and if tomorrow follow the trend we will be lower again tomorrow night on the long bond.

The market was again very thin today as there is still a lot of incertitude about the economy. Overnight we brushed over more than one dollar wide before the numbers came in... They came in on the strong side. From there on it was just downhill with some very nice opportunities for short term trend followers... We had a fairly good day until we tried to test the
114-10/12 area for support after the 10Y auction... After an initial bounce, the market sold off on stronger equities and we just stayed stuffed with our longs... Need higher prices tomorrow or at least overnight as our targets are not too far on the upside.

12/12/2007

T-Bond trading comment (December 12, 2007)

Okay, that was an erratic session... It almost felt like the market was a trapped mouse trying to escape but not kwnowing where to go...

Arrived this morning on downward pressure after yesterday's little panic. This subsisted until the FED came in announcing a concerted plan with other central banks to inject liquidity in the market, thus alleviating the pressure for financial institutions to fund themselves... This had an immediate impact as stock indexes soared on the news and bonds got killed... Basically the market started to deprice the credit crisis and dreamt off higher growth for next year... This did not last for very long and we found some support in the mid 114s again (We had already tested these levels on Friday). From there on we skyrocketed back towards pre-announcement levels as the market grew again aware that we were not yet out of the bush... The day was volatile but gave very nice trading opportunities as the trading was not choppy.

We got killed on our daily momentum trade which recommended to buy at 116-15, but at least we made some decent money today nibbling the market at juncture points... Did not cover for all of the the loss but at least part of it... Also still sad to have let go my Jan08 call spread on Friday...

12/11/2007

T-Bond trading comment (December 11, 2007)

We've been saying for two days that the drop has been too abrupt and that we need to maybe take a breather.... We are almost up two bucks on the day! We did not expect that much

The market opened the day up and kept climbing the whole day in front of the Fed. This move was nice and well expected after rebounding against the 114-10 area yesterday (level on which we took off for our preceding run-up). This part was fun and easy to nibble as the market moved in nice little waves.

Then the Fed came... The Fed did less than what the market expected and the market did not like that... Results everything that was not risky just jumped up as well as credit risk instruments. The FED cut by 25bps the fed fund and the discount... Statement dropped the negative bias on growth but said there was a lot of uncertainty both on inflation and growth... Blabla... Right now, we see high inflation in Europe, China is even worse and GDP is running at 4.9% on a annual basis... Ok, given that with the subprime we could see a slowdown.

Today's move in the market was rather surprising... Such a move to the upside means that the recent downmove (almost 5 bucks peak to through) was just smoke and we are in for good on the long side... Unless of course the market is just stupid and today was again another panic... By the way, don't expect Libor to tighten much, because the Fed's move clearly indicated they are not too concerned about liquidity problems... If they had been, they would have lowered the discount by 50bps, not 25. Granted, they could still flood the market with cash.

Also our daily momentum turned bullish at the settle... So we put on some longs but betting the farm on that would maybe be a bit too bold... Wouldn't be surprised to see the market relax tomorrow.

12/10/2007

T-Bond trading comment (December 10, 2007)

The other day, the market was too pessimistic about the future of the economy... Now it seems, that we are too optimistic... For a fourth consecutive day, the T-Bond went tumbling down as market participants re-adjusted their view. Every day, we now hear some positive news (MBIA receives cash injection from Warburg Pincus, Soc Gen takes 4.3Bn SIVs on its books without affecting its capital ratios) and the only bad ones we hear are transformed into good ones ( We are thinking UBS). In addition to that, we had all that talking about long term inflation over the week-end and how this should send fixed income instruments lower...

In any case the market looks bearish in terms of price, but the recent drop seems rather too abrupt... The fall as been so fast that our daily elasticity model went from overbought a week and a half ago to almost oversold. In fact, we had bids at 114-02 to buy the market for a jump the other way. We did not go that low but the market maybe needs a little breather before resuming its downmove.

Tomorrow is FED day as we talked earlier. Market is pricing 25 bps rate cut but people are also looking to see if the Fed will cut its discount rate by 50bps... This would be a way to help the liquidity crisis without lowering the overnight rate by too much....

12/08/2007

T-Bond trading comment (December 7, 2007)


Well in the end the reverse hammer we saw last Friday ona weekly chart proved to be right for this week as we have sank by two bucks since then and almost three since the top seen on Tuesday. Is there more room to the downside? There is always room for lower prices when you are in the 115s but maybe the recent drop has been rather too abrupt... In fact it has been so abrupt that our elasticity models that were in the higher bands are now nearing the oversold thresholds on the long bonds... In addition to the abruptness of the drop, we also have to take into account the 115 line on which we bumped today... This line has been a major haggling area for the last few years as shown on the above graph (the big fat purple line).

Today was a nice downward, no surprise day. We opened and started to go lower and basically just kept going down all day long. This downmove was spurred by several factors. First, we had the Paulson's subprime rescue plan and secondly we had the quite strong NFP. Granted the trend is downward on the NFP, but there is hope. Such a number must have calmed a lot of people on the street as it gives us reassurance that the consumers will continue to consume as they have a job and thus money flowing into their bank accounts... So for now, everything is good...

Next week, everybody will be looking at the Fed on Tuesday... According to the Euro-dollars, the market is widely expecting a 25 bps rate cut... This is less agressive than earlier this week when the market was giving a 50-50 probability for 25 or 50 bps rate cut... There is still a fair amount of people in the market that thinks that the Fed should maybe do more than less and cut by 50 bps given the actual poor financial conditions, but this is not what the market says (Options, Euro-dollars and Binary options all point to a 25 bps for now).

12/05/2007

T-Bond trading comment (December 5, 2007)


The last two days have been firmly bearish with only slight pick-ups when bad news where hitting the screens... Today was the turn of MBIA... Moody's announced that they were not so sure about MBIA not experiencing a capital shortfall in case of worsening credit conditions. That lilttle upward move was crushed and from the top, we lost a whole dollar in three and half-hours. This move on the T-bond was a bit strange by the way, because it was not mirrored by the 2, 5 and 10 years notes....This means it was probably not some steepners being put on because if so one the other maturity would have gone up... The other solutions are either a large long position was being dumped by someone who took its profit on the recent run-up or someone paying fixed in the long end, thus forcing the receiving bank to sell the 30s to hedge the direction. In any case, this move pushed the T-bond back to its long term fair value against the T-note according to our elasticity model. This move also pushed the T-bond towards its recent support levels sitting in the high 116s.

Today, we saw the ADP number get out on the very strong side at almost +190k.... This is extremly bullish, but we have to be cautious with the number as we have seen in the past ADP sometimes gets it wrong... One more day to wait until the real number... If the NFP comes out that strong, we might see a real bloodbath in the market since in addition to strong employment data we also have the government working hard to find a solution to the subprime crisis...

Did you know?
If you take a weekly chart, you will notice that we have been climbing for 8 straight weeks... When was the last time this happenned ? The answer is in 1998... So what we are seeing in the market is pretty rare and just add to the temptation of selling the market if not already done....

12/04/2007

T-Bond trading comment (December 4, 2007)

Well, the reverse hammer does not look to good right now.... Since the close of Friday, we have climbed by almost a buck on heightened risk in the credit markets... The market remains very fragile and will shoot up as soon as an opportunity presents itself... On the other side of the trade, we are hearing more and more people saying that its valuation is maybe getting on the rich side. With the bull run in the commodities and the inflation creeping up in Europe (look at Euro-zone CPI...) it might be logical to see lower prices in the long bond.

Today was a real rollercoaster. Go up, go down, go back-up, fall again and close unchanged with yesterday.... And this was in the face of falling equities. Don't know if this is the start of the reverse trend but we have lots of room to the downside!!! Looking at our non-stationary model, we see that the last time we visited such distortion levels the T-bond had skyrocketed to 123 from the 110 area. After that, the market tanked by almost 20 bucks... We won't do the same thing this time, but maybe a little downtrend wouldn't hurt anybody.... All that said, with the current market we can still go higher...

12/02/2007

The week ahead

Interesting week we have ahead of us! From a techinical standpoint, we have just formed a nice reverse hammer on the weekly chart and last time such a configuration like that presented itself, the market strongly reversed its course... So let's wait and see. Still in that same vein, our non-stationarity model tells us the market maybe needs to catch its breath a bit...

Now from an economical point of view, we have plenty to look at this week. For one, we have the ISM reports at the beginning of the week but we also have the Non-Farm payrolls on Friday! This will be very interesting especially given the actual context of a slowdown in the US. In addition to that, we will also follow the Government's efforts to stem the housing crisis. Lastly, this week the BoC, the ECB and the BoE will release their rate decision... This will be most interesting to follow as the Fed will go live the week after.

12/01/2007

The month ahead: December 2007

Fundamental view:
The credit/liquidity crisis is still there and housing is still making new lows. What more is there to say? The market is predicting more and more a hard year for 2008 with the possibility of a recession in Q4 2008. For now, the market is waiting for the FED to cut rates one more time at the December 11th meeting. Otherwise, there isn't much to say except that it will be very interesting to see December data come out. Jobs and inflation will be of particular interest as these two points have shown a certain strength that has been missing in the rest of the economy. The market seems also more rational following the little panic we had on November 26th. The panic seems to have cooled everyone and we are now all a bit more rational. So next time we climb up, we might do it in a more orderly fashion. This move reminded me of what happened in mid/end June 07 when we saw some extreme bearishness conclude the downward run we had started a couple of months before.

For now, we might end our bullish trend with the rumours circulating in the markets. Noises say that the government is toying with the idea of a freeze on mortgage rates, which would most likely stem the housing foreclosures we've had in the last few months.

Seasonal/statistical point of view:
Last year the beginning of December had signalled the end of the summer/autumn rally as the market reversed sharply and quickly went on to loose a bit over three bucks.... But looking at history, December has never been a month prone to see lower prices... The main theory is that as year end approaches, people dump there risky holdings and buy safe haven assets like govies. Altough this year, I would bet that a majority of persons have already dumped their risky assets. Anyhow, looking at a seasonal chart, the trend is clearly for higher prices. Over the last 7 years, only twice did we see prices drop... Over 20 years, prices fell only 7 times during the month of December.
Looking at our elasticity index, we can see that there is nothing to do on a weekly basis but at least we saw some action during the month of October on the daily elasticity model. Right now, both models suggest "nada"...


Technical point of view:

After blasting trough all the resistances during the month of November, we will most probably test those new supports as the market might give back part of what it has taken in the last few weeks. Why this bearishness ? The answer can be found in the post of November 30th, where we talk about a weekly reverse hammer... The supports for December are the 117-10 zone (on it right now), the 116-10 area, the 115 level, 114 level and finally the 112 zone. The last few supports might be hard to reach but the first three are do-able. If ever the market goes the other way, there is not much to look at. After the 119-15 area there is nothing before the tops we visited in mid 03 at 124-12.


11/30/2007

T-Bond trading comment (November 30, 2007)


The week is almost over and the close is not the most bullish as seen in the above graph. We have formed a nice hammer and according to chartists this is a bearish signal rooting for a change of direction. This would nicely cap-off the current run and would enable us to see lower prices...

Today was quite interesting. After initially trading higher, which enabled us to unload our long at 118-04 (we were lucky), the market went crashing down as equities posted another strong performance all across the board on probabilities that the Fed will cut rates and other central banks will follow suit. In a little less than an hour, the market lost a complete dollar before regaining a bit. Sadly, we missed that opportunity. At least our options are the right way... Afterwards, the market whipsawed between116-29 and the 117-10 zone enabling us to nibble on each side of the market. Liquidty was rather scarce today as it was year end for several US-dealers.

Next week, is a new month and the last of the year. The week will climax with the job reports on Friday... The market is expecting a softer number after two strong numbers.

11/29/2007

T-Bond trading comment (November 29, 2007)

After a little calm, the T-Bond has restarted its forward march, RSI is back at more reasonable levels andelasticity is ok, thus leaving room for higher prices. But if we look at a weekly chart, the picture might not be that bullish... Depending on tomorrow's close, we might be forming a reverse hammer. If the market closes in the low 117s, we would have a nice candle picture which could signal a reversal of the latest trend... Just to remind ourselves, this is what signaled the present bullish run we started at the end of June 07.

All that said, today was an interesting day with clear trends almost all day long. The 117-20 level offered some good support while the 118-06 zone provided us with a resistance. All in all, the market climbed by almost a full dollar today. This move was not a complete surprise with the continued widening of the LIBOR levels, the weak equities overnight in Europe and the month end buying indexers that have to re-adjust their portfolio duration to the upside. Another signal was also, yesterday's monter move in the equities that was not followed by the bond market. They only went causiously down, letting us know that if the equities showed any weakness', they would shoot up and that is what happenned today...

Our daily momentum turned long at the settle. Now we need a 118-05 print to be happy... We might see it on any weakness tomorrow as more people jump in the month-end band-wagon. Tomorrow we have PCE data as well as CPM.

11/27/2007

T-Bond trading comment (November 27, 2007)

Reversal day! After yesterday's run-up, today we saw some nice distribution. At one point the market was loosing alsmot 2 bucks... Talk about crazy days.... The short we put in place yesterday at the settlement was taken off during the night as the T-bond went crashing down, before picking-up ground for our open. From there on, the market essentially monitored what happened in the credit and equity market for the rest of the day...

If you think that the market is too high and don't want to risk too much money, an interesting play is to buy put spreads... This morning at one point, the 117-116 put spread for march was trading around 22/64... This is almost some 3 to 1 profit ratio...

That is it for tonight. Short message, no time for more

11/26/2007

T-Bond trading comment (November 26, 2007)


I have nothing to say except that we are in panick mode. The market in my opnion is a bit ahead of himself... But hey who am I to decide when the T-bond is high enough...

The whole day was bid, bid, bid... Our daily elasticity gave us the go ahead to short the market at the settlement... Now we need to see a 118-9 print to be happy. Our short call are getting whamed... Granted we still have protection room but the MTM is not friendly right now ( vega and prices higher)

I don't want to appear too bearish on the future direction of the T-bond, but today's run-up was mainly done while the stocks where only midly down (got killed after the settle although) and swap spreads were also loosing ground... Weird...


11/25/2007

Economic Focus: Week of Nov. 26, 2007

The market is going to focus on three items this week. First, Thanksgiving shopping data supposed to come out on Monday. Experts are expecting relatively strong numbers. Secondly, GDP data on Thursday. Is the economy still growing at a good pace? The advance number for Q3 showed a strong number on Oct. 31st. Finally, as the market has done in the last couple of months, it is going to focus on more credit related stories .

In addition to that, several numbers are due on the housing sector for the last three days of the week, but it is very doubtfull they will shed more light into the problem...

11/24/2007

Week-end thinkering! Can we go higher?

Looking at the above chart, we can see that on a historical basis the market seems to be overextended, but the last time we moved by that much in such a period were crisis times... The last three years where we had these kind of moves were 2000, 1997 and 1990 (the last two are not shown on the above graph). Each time we were in the middle of a crisis: Tech bubble imploding, Russian/Asia/LTCM and recession in the US...

So yes we can go higher even if the market is overextended right now... Although the recent move maybe needs a small correction before going higher

11/21/2007

T-Bond trading comment (November 21, 2007)


Bulls are on steroids with what continues to happen in the credit market. In fact the market seems to be panicking a bit (as seen in Europe where the players in the Covered Bond market decided to completly stop market making activities so as to stop the blood shed since bids are non-existent). Another days brings another trolley of bad news and the market just keeps going up in sympathy with the problems despite the fact that it should maybe relax a bit.


We arrived this morning, with the market almost up a buck overnight on rumours that ACA and SCA might be downgraded and that ACA was even considering Chapter 11. If these two bond insurers are effectively downgraded, this has major implications for the bond market. In addition to that, we also had more rumours coming out of the UK on funding problems for several banks as well as massive capital injections... To top this off, we were just in front of a very long week-end (even if the market is open Friday morning) and with the kind of newsflow we have right now, the only news we can have until next Monday will be bond supportive... Oh yes I just forgot, equities got hammered, again, we have now erased all of 2007 profits and I think that we might be headed for much lower prices even if there is a nice support at 1411 in the S&P500 futures to be tested first.

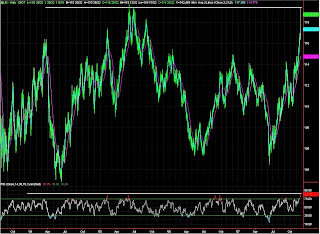
Today's trading was well supported at yesterday's resistance of 116-14. In fact, since 3:00 AM in the morning we bounced on it for a total of 4 times. The upside was somewhere near the 117 line, but the market seems to be completely driven by the credit news and when there is no news, the market simply stays put... In the past month and a "quarter", the market has now rallied almost 7 dollars and this is after a previous rally of around 6 dollars over the summer. How much higher can the market go ? Obviously, with the actual context, it can go much higher but the January 122 calls (exp. Dec 21st) looks attractive at 11/64. There is 29 days left before expiration and we are still 5 bucks away from the strike... So this means the market needs to rally by 12 dollars in total since mid-October before the short sell get in hot waters. Not impossible, but unlikely...

This week's Friday is known has the Black Friday and is the most important shopping day in the whole year. The market will be eager to see the retailers numbers as fast as possible since they usually give a good pointer as to where the Q4 GDP will come out, how the employment will be affected as well as retail sales. Estimates are pointing for a strong number...

11/20/2007

T-Bond trading comment (November 20, 2007)

Are the bulls loosing breath ? We bounced all day round between 115-28 and 116-14 and closed at the low end of the range... Not the most bullish especially since the T-Bond is overbought, the FOMC was more or less bullish for the economy and the 116-14 level has been a resistance level in the last hours and is also a longer term resistance we had 2 years ago.

We opened the market, on the bullish side this morning after creating the low overnight on strong european equities. As the stock market opened on the strong side, the long bond scaled back from the 116-14 level. After reaching again the lows of the day, we had the Countrywide rumour... Apparently, CFC was to file for bankruptcy, but the stocks was trading a 9.8 when we heard it and in general a company on the verge of Chapter 11 is not trading at 10 bucks.... Any how, the market went back up as we waited for the Minutes. They where kind of mixed, but overall they were kind of bullish.... Afterward, the market just slowly drifted down to close at the 116 mark.

Option expiration was today and we finally took off our option strategy... Definitely not the best month... In fact the worst month in a while. The only good thing is, as the market was falling we did not cover the delta right away and were able to recoup 23% of the loss... Otherwise not a super day, with the whipsawing, trend followers got hurt and our momentum models on EDs didn't give the right direction.... Better chance next time!

11/19/2007

11/18/2007

The week ahead

Another short week ahead! In total we only have 3 trading days this week, but realistically the market stop Wednesday at noon.

Accordingly to this shortened week, the economic calendar will be light. The highlight will take place Tuesday afternoon with the release of the FOMC Minutes. In addition to that we have housing starts Tuesday morning and leading indicators Wednesday morning.

Tuesday will also so be expiration day for options on T-bonds, so our option strategy will come to an end. For a second consecutive month the strategy is not doing very well. The strategy is only points away of flat trading... but there is still two days ahead.

11/16/2007

T-Bond trading comment (November 16, 2007)

New high again today but rather weak close for the week-end. Altough after yesterday's monster move, today's consolidation was to be expected...

Arrived this morning at the office after challenging lower and higher prices that would proove to be the resistance and support level for the rest of the day. As people arrived at their desk, the market was getting challenged as stock futures were climbing. This lasted until the stock market opened and started to loose ground. From there on, we developped a nice upward trend that nicely topped near the high we created early that morning. We spent the rest of the day oscillating around yesterday's close climbing to 115-17 for the close as equities were being hit. In the afterhour session, the T-bond lost again some ground as equities shot higher to close with a 0.5% profit for the day.

The market is still fearing for more bad news to come, as we saw some fresh steepners being put on 20 minutes before the pit session close. The T-note was gaining 4.5 ticks while the T-bond was only up 4 ticks. Normally the long bond should have been up by at least 6-7 ticks.

Yesterday, we said that we were entering into a new configuration that enable us to see much higher prices... We still stand by this scenario, but it is important to bear in mind that in Europe, the Bund is still not able to make new highs and is still stuck under the 115 line. At one point, the bulls will run out of time, so the sooneer, the better.

Our option strategy is expiring Tuesday afternoon. Right now the strategy is a little in the red... To flat trade we need the T-bond to close at 115-7 so let's hope for lower prices in the next two trading days. As for our daily momentum, that showed the green light at 3 o'clock yesterday we had a better day than what we were expecting with a close at 115-17.

11/15/2007

T-Bond trading comment (November 15, 2007)


New high! We broke through 2 years old highs by closing at 115-12. This was realized on the back of weak equities and heightened risk of more problems in the financial industry. These are fancy reasons to say that the real answer is simply that the market is really bullish and the market is bid. This was plainly evident during the day when equities had not yet crapped out and were simply oscillating around the zero line while bonds were going higher and higher.


We arrived this morning at the office, with some passably bad news from the UK ( more banks, more in troubles). After testing yesterday afternoon's support at 114-08 early in the night, we started to climb back higher and even had a start to 115 line. This was a good point to sell the market, but only the first time... The second one was less fun... Especially since we went through it like a bullet... In any case, we are now developping a new scenario. By entering these waters, we are opening the door for much higher prices since we switch on the double bottom scenario (see The month ahead: September 2007) with a terminal target of around 123... For now the first target is 116-10 then 118-10. We could see these levels, if the credit related crisis goes on.

Our option strategy is now starting to bleed since it is naked at 115... Funny thing that 2007 would prove to be so trendy after the last three years much more choppy... In any case there is three days left so it can still go down! Also our daily momentum strategy clicked the green light at the close for higher prices tomorrow... Our conviction level is not huge on the trade after today's monster move, but we entered it at 114-11... No point in developping models if you are not going to follow them eh?

11/14/2007

11/12/2007

The week Ahead

Short week ahead for fixed income players as the market was closed today.

We closed last week at the top of the market for 2007 and near 2006 tops... The question is will we break convincingly to the upside or remain in the large trading range between 105 and 115? Economic data roots for lower prices with relatively strong consumption and strong employment numbers but we are in the middle of a financial crisis and bad news just keep pouring in (today was the turn of e-trade).

This week's economic datas are Inflation numbers (Wednesday and Thursday), Retail Sales (Wednesday) and Empire State Mfg and Phily Fed surveys (Thursday)

11/09/2007

T-Bond trading comment (November 9, 2007)

Okay, we have busted through the 114-00/05 and we are now closing in on the
115 level. Last time we visited these lofty levels was in December 06. In fact, the 115 vicinity has been the top side boundary for 2006 trading range. The 115 level has been a major resistance for the past two years.


Will it hold again this time ? Time will tell. One thing that's sure, is that it won't be the market elasticity that will bring back the T-bond lower as it did in December 06. Our elasticity model is calmly in the middle of its range giving no indication of an over-extension.

We arrived this morning with again the same pattern we have seen in the last few days. Run-up in the prices overnight, until 7h00 AM and then the start of a selling wave that usually bring us back in the mid 113-20s. But this time it was different. With half day trading and the perspective of a long week-end, market participants covered their shorts in the long end.
This up-move was not due solely to covering of directional position. Today, was also the first day that we did not see or hear massive steepners being put on, in fact curves even came back a bit and so gave some breathing room to bullish intentions on the long bond. In terms of trading, our amputed iron butterfly is getting closer to hot waters since he is naked at 115, but our momentum and intraday directional models had an honest day.

So what is up for the end of the month ? Can the T-Bond go much higher ? Well the easy answer is yes, especially given the actual context of financial crisis. But if we approach this question from a statistical point of view, we would tend to say no. Looking at the behaviour of the T-Bond during the month of November over the last 30 years or so (the graph only shows the last ten years), and we see that the long bond rallies no more than 2.25 dollars durring these 30 days 80% of the time. Now the question is, by how much did the T-bond rally during the first nine days ? The answer is a bit over two bucks, thus leaving only a slim potential for higher prices. Finally, as we mentionned in the first paragraph, the 115 level has also been as resistance area since the end of 2005.

11/08/2007

T-Bond trading comment (November 8, 2007)

Days pass by and the market remains the same. Bearish intentions in the morning quashed by bad credit/losses/downgrade/liquidity/... news during the rest of the day. Today was no different than the rest of the trading week as we closed still hovering near the 114-00 yard line. The market seems to have bearish intentions but the actual financial crisis keeps prices-up as no one seems to be willing to sell the market.

The market opened on the strong side overnight challenging the 114s, as european equities were susbtancially lower. The Bund made a gap at the open but subsequently filled it, fuelling bearish convictions. This lasted until 9h40, just before Bernanke. In the mean time, scalping on each side of the market was profitable but not trend following. About then, the market started to climb as bad news started to hit the screens at the same time that Bernanke was reiterating the Fed's view for sluggish growth in the next 2-3 quarters and continued problems in the financial markets. Nothing new there but it had the expected impact. Stocks tumbling down, bonds higher and curves steeper! In late trading, we subsequently retraced or moves to the downside leaving the T-bond about unchanged.

What to expect for the next few days? The market looks like we are due for lower prices over the next two weeks but the short term will be controlled by the amount of bad news that continue to fill the screens... Also, from a graphical point of view, we aren't able to make new highs but our lows are higher and higher... Tomorrow is half day with no work on Monday. We have trade balance, import prices and U of Michigan.

One last thing, our daily momentum model is showing the green light to be long for tomorrow, but tomorrow is a half day... So could be weird... The lights turned green yesterday for eurodollars futures...

11/07/2007

T-Bond trading comment (November 7, 2007)


Another day passes and we are still under the 114 level even after an unsuccesful try to the upside early this morning on more credit news... We are about flat over the day but this is only due to some steepning trades being put in place. If it was not of that, the T-bond would be much higher as are the 10 and 5 years notes. The T-Note closed on the top side of its daily range while the T-bond just bounced off its lows and slowly drifted higher but with a good lag.

For the last few days, we have been consistently bouncing off the 113-13/16 area. This would tend to indicate that this is becoming a new support level that would favor higher prices... Options are also showing more potential to the upside. This view can be easily explained by the fact that given the current context, people tend to prefer longs against shorts and will therefore be unwilling to sell in the wind even if long targets are reached. Talking about targets, the bund has bumped again, against the low 114s... It will be interesting to follow its pattern.

Stocks and news were definitely bearish with stocks getting hammered (Dow Jones down -2.64%). The only piece of news reaching ours ears were either about losses, writedowns or weak capital ratios... Not good. Also, we had several Fed speakers that were not exactly bullish...

Tomorrow, we have 30 years auction which could put a bit of pressure on the long bonds in the morning. Also on the economic front we have Claims and Bernanke testifying about the US economic outlook...

11/06/2007

T-Bond trading comment (November 6, 2007)

For now the 114-00/05 resistance holds thanks to advancing stocks and tomorrow's 10 years auction. We arrived this morning with some choppy trading to the downside that offered plenty of opportunity for some scalping as we were bouncing from the bid to the offer all the time. The only time of the day where we had a bull run was just before Morgan Stanley announced new writedowns. This was the perfect moment to short more bonds, as recent history showed us that it was profitable to do that(eg: look at last week...). The rest of the day was on a downward slope as we went back to reach the 113-18 zone.

Does this means that the bull run is done and we are starting a new bear leg? Well no, not exactly, with the recent run to the upside, we could very well be in consolidation still... To confirm a bear leg we would need to break the 113. Just worth of mentionning, the Bund did not succeed to advance today despite rather supportive economic data. So...

Fresh beer is waiting for me.... So more tomorrow.

11/05/2007

T-Bond trading comment (November 5, 2007)

I am back from holidays and the market is radically in another configuration than when I left! When I left for holidays, the market was firmly in a bearish move and we were trying to break the intermediate resistance standing near the 110 level. In the end, we did a nice little double bottom configuration and went back-up on the back of the return of the liquidity crisis.


Now the interesting question is where are we going ? The conscensus we are hearing on the street is that we should see higher prices before lower prices, but to confirm that we have to overstep in a convincingly way the114-00/05 level that has hold (minus a few overpass) since December 06. Granted, Friday we went to see much higher prices on the back of bad news in the banking industry ( Merrill's CEO out, Citigroup's CEO most probably out and a score of huge write downs by lots of banks in their fixed income books), but after testing higher prices this morning we went straight back toward the 114 level. This week will be interesting to look at, because there is no big economic news on the radar so the market will be able to develop its own story. If we do not overpass the 114 level significantly, we could see the 112 level as a first target and 110 after. It will be especially interesting to look at the T-bond's move since the Bund in Europe is closing on upside targets.


Did not look to much at the trading session today as I was touching back with the market.... Satisfied myself with some small scalping in the T-Notes and T-bonds.

10/11/2007

Honeymoon

Please note that I am taking a three week honeymoon and consequently, there will be no post made in the meantime!

I will be back on November 5th.

Cheers

10/10/2007

T-Bond trading comment (October 10, 2007)


Another indecisive day ! After trying new lows in the morning session, we reversed the bets but failed on the 111-03 threshold. Afterwards, we slowly drifted back toward the opening price on low volumes. Pretty early this morning, the market tried new lows and we did break through the 110-18 level but the move was not very convincing and in addition to that stock future were getting a bit tatooed and we promptly went higher. This leg to the upside was pretty easy to forecast and many people jumped on the band wagon.


Beginning of the afternoon, we arrived at yesterday's high and resistance for the last three days at 111-03/04. This was the signal to take off the longs (personnally we took them off much earlier and much lower ) and see what the market had in the stomach. In the end, we failed to the upside as we failed to the downside in the morning and retreated to our opening price for the close. Short vega players are happy as volatility has been crapping out for the past week.
Tomorrow we have import prices as well as claims and monthly budget statement... Nothing overly exciting.

10/09/2007

T-Bond trading comment (October 9, 2007)

Funny day. For those of you who though we would have a follow-through day got it wrong. We finished flat ! Although we didn't have a follow-through, today's pattern was not overly surprising. After the monster move of Friday, we assisted to a consolidation day. Early last night we unsuccesfully tried the lower support before bouncing slowly upward until we hit the first significant support we met on Friday which today served as a resistance (111-04). After that the market readied itself for the FOMC minutes. Minutes were slightly bullish and market started to tank but pretty fast we saw T-bonds stop the bleeding while shorter maturities were not able. This is indicative of flattners being put on and this theory is consequent with what we hear from bond desk around the place trying to convince everybody it is time to put flatners on. In the end, we closed at 110-26 up 1/32.

Talking about the FOMC minutes, they shed a bit of light but were somewhat disappointing. One thing clear, the rate cut was unanimous and done in order to stem a possible recession. For now, the fire seems to be tamed on the recession side but is the inflation fire tamed? The Fed thinks that yes right now inflation looks to be under control but the Fed does not seem to have a lot of control over anything... In any case, the important message to keep in mind after this text is that the Fed looks to be on hold for a bit of time. Consequently Euros went down and curves flattened....

Tomorrow will be a calm day on the economic side, but it will be interesting to see if the market is able to break throught the support we created on Friday at 110-18 and on which we chocked today. If we do break it, the next target is the 110 figure level

10/08/2007

The week ahead

Short week this week for fixed income traders! The week is relatively calm in terms of economic data except for two things: 1- FOMC minutes on Tuesday and 2- Retail sales on Friday.

The minutes are avidly expected, because everyone will want to know why the Fed cut rates by 50bps and especially how important was the -4k NFP in August in the decision to cut rates. We will remember that the market was expecting a 50bps cut and that is exactly what the Fed did, but it is a bit unclear why they did so. Sure there was continued problems in housing, the liquidity crisis and the poor job report, but was there something else? In any case, some light will be shed Tuesday afternoon!

Retail sales on Friday will also be of interest to take the pulse of the consumers. A slight pick-up is expected after the disapointing September number... Year to date, the numbers have been slightly mixed...

Of secondary interest in the economic arena, we also have 10y tips auctions, consumer sentiment, PPI (let's wait for the CPI), import prices and business inventories.

Looking at the T-bond, the big challenge this week will be to break below the 110-00 level if we want to continue on Friday's venture. Otherwise, to the upside we are still looking at the 112 area.


10/06/2007

T-Bond trading comment (October 5, 2007)

That was a real curve ball that a lot of people did not see coming! NFP up 110k and revision of +93k for the preceding month ! Evidently, T-bonds got trashed... Two months ago, I underlined the importance to not take face value on NFP data... Basically, the error margin on the NFP is something around 70k and this month we've had the perfect example with a 93k revision sending the market in turmoil with people scrambling to re-evaluate their view of the economy. Let's just hope that the Fed did not put too much weight in August's NFP to cut their rate... In any case, unless very adverse economic conditions come in the very near term, it is safe to say that the Fed will probably not move for the rest of 2007!

So the 112 line looks a bit far from the 110-25 line. After playing with it for the past week, we have cleared away on strong NFP data. Until the number, the market did not want to move away as it did not knew were to go. After that, it was all the way down except in the last hour and half of trading were people were just covering their shorts for the long week-end. In terms of trading, you just had to be short. Our intraday trend model gave us the tip (believe it or not) 1 minute before the NFP. The model covered just before the final bell on the little pick-up. That was the good trade. The bad trade was our swing trading model that was bulllish coming in this morning... The cost was over a buck today and wiped out just over a third of the yearly profit on this model... Not good. Better chance next time.

The option corner

Two points:
1 - The iron butterfly we've put on Monday is high in the sky after today's NFP data. For now, we have been very lucky this month as we have sold our 111 call on the 2nd of October after reaching the 1$ target move. Now, the lower the T-bonds close on the 26th the better it will be! Although, don't celebrate yet... We are still early in the month and a rally is still possible.

2 - Options are still expensive, yesterday we were looking to buy a November straddle and were in the end deterred of doing it... Too expensive. Good thing we did not do it. The 111 strike lost money and the 112 one barely moved up by a paltry 4/64....

10/03/2007

T-Bond trading comment (October 3, 2007)

For now, the 112 line has held on a daily close. After testing new highs in the morning, we broke the 112 line and held there for the rest of the day, even if for the close we made a half hearted try to reach again the resistance level. All morning long we bounced on the 112 level, but never did we overpass the 112-10 level that also contained yesterday's push. ADP numbers came in as expected and at 10h00 ISM non manufacturing came in sligthly stronger. This sparked some bid in the equities and credit indices as people momentarily forgot about the ongoing liquidity/credit crisis. As expected, bonds went on to visit lower levels and there we broke the 112 line. test

We lost almost half a buck between 10h and 12h before the bids started to disappear in the equities and from there we started to climb back. But this attempt to close over the 112 line failed and afterhours we resumed our descent... On Friday, we have NFP and there is a theory going around stating that Friday's NFP will be higher. The rumour says that due to technical problems the September NFP was missing 30k and that they will be added to this month number, hence the expected stronger number.

10/02/2007

T-Bond trading comment (October 2, 2007)

Okay we have overpassed the 112 line but for now, this passage does not look too convincing. In fact, we closed the day barely over at 112-01 after trying higher highs and failing on heavy offering. We arrived this morning with the T-bond being hit as European equities were on fire after yesterday's Dow Jones performance. While waiting for the pending home sales, we had some interesting range trading comprised of yesterday's support at 111-16 and 111-25.

At 10h00, pending home sales were out and worst than expected even after last month monster loss. As expected, this sparked a rally toward the 112 line. After a bit of hesitation, we went through and went up to the 112-10 level. This was the perfect level to sell our 111 call since the market had moved by one dollar since we put on the trade... yesterday (Historically, it takes a bit more time to reach the 1 dollar level). In the perfect world, we would now want to see the 112 line holds its ground and send the T-Bond lower... We will see in the coming days.

We are getting closer to Friday and the NFP... The market is pricing a +98k which is pretty strong, if we come under that we could very well open the door for higher prices. By the way, the CGBs and the Bunds have both cleared their configuration for higher prices. Their targets are about 2 bucks higher each. Stay tuned for the US...

10/01/2007

T-Bond trading comment (October 1, 2007)


It looks like we are pulling away to the upside... But beware, we haven't passed the 112 mark which is a resistance line as well as the monthly moving average. We arrived this morning at our offices while the market was trading unchanged after an earlier challenge to the upside. With no specific data before 10h00, the market drifetd aimlessly in a little range on low volume... At 10h00, we had ISM indexes, they were a tad lower and this gave some fuel to the bulls to run-up prices but we failed at the 111-26 line. After that, we drifted back lower to sit on the preceding top, made just before 10h in the 111-16 zone. This support holding, we tried again to the upside but with the afternoon coming to an end we failed on the 111-28 line which, by the way is the level on which we failed on Friday... 112 seems to be a bit tough to overpass right now.

So what is in the books for tomorrow ? On the economic front, nothing big with only pending home sales. But equities have closed at a record high (Dow Jones) and we have the 112 line standing in front of the bulls, so let's say that right now the odds are skewed to the downside...

Today was the first trading day of the month, this means it was time to put on iron butterflies. The strikes 109-111-113 were retained and the first stop is either 112-7 or 110-7. The price was pretty steep in comparison with 2007 & 2006 prices but again market is a bit more volatile right now and this month, the option is a bit longer than usual. We will see what will happen.

9/30/2007

The month ahead: October 2007

Fundamental view:
The market is very nervous right now and does not know where to go. On one hand, we have a possible economic recession looming around the corner while on the other hand, we have market participants selling US debt because: 1- Possible long term inflation problems and 2- Foreigners dumping US debt in favor of Euro denominated debt and others.

This clash between the two views gives us relatively low daily volatility but very high intraday volatility as we have seen in the last week. This month data will be very important to help us figure out where growth is going and also where is inflation going. Right now, inflation seems to be marginally leveling off while growth is still there. In fact, looking to all of this more closely, it is only NFP and consumer spending that are affected... But they usually precede more serious troubles, so we will be looking for some confirmation in October's data.

Also, last point to check on our fundamental checklist is our liquidity/credit crisis. In apparence, things seems to be getting better but the market is still pretty tight. We still have a lot of bad news coming out of Europe while in North America, we just keep falling lower and lower in the home sector. Another sign that the market is pretty tight right now was the Libor that had a little run-up last week as people were scrambling for cash for the end of month and quarter picture...

Seasonal/statistical point of view:
October has a slight negative bias if we look back over 10 years, but over the last 5 years, the answer is very clear: Go short.

Looking now at our elasticity index, there is again nothing new there. Like in September, the index is standing right in the middle of its range stating the T-Bond is fairly evaluated compared to other assets and nothing interesting can be done over weekly/monthly horizons. Looking at it on a daily basis does not give more solace as no signals were clearly identified. The closest thing we had to a real signal was a partial alert to sell at the close on September 11. Looking back this would have been a great trade, but no official signal = no trade = no money... Too bad.

Technical point of view:
Looking back to what we had predicted for September we see that we opened the month with the bullish scenario but failed to break out of the top at 114-23. If we had broken it, we would have confirmed an almost 2 years double bottom and opened the door too much higher prices. In the end, the downward resitance line kicked back into play after being violated and we went straight for the first support at 110 where we held and bounced higher afterwards.

October is the first of a sery of tricky month because usually they lack a clear trend... They will drop like like a rock and from no where zip back-up in the blink of an eye rendering trend following very hard. So the play in those autumnal months is to play support and resistance.

Support levels to look at: 110-00 (Tested in September)
108-20 area
105-14

Resistance levels to look at: 112-00 (Tested on Friday)
113-15
114-25

The option corner

Options are expensive right now. That being said opportunities are still around for people who like to be long vega. On september 20th we had a signal from our breakout model to buy straddles and they were sold back this morning while the market was at 111-21 for a small profit.

The actual context seems a bit tough for volatility buyers since daily moves are very small, but opportunities are present since we have huge intraday vol. Just think of today where the market closed unchanged on a daily basis but had a range of over 1 buck for the day. Taking all of this in consideration, market participants who want to buy vega must be careful of where they pick their spot and look throughout the day for sell points.

October is starting Monday and iron butterflies are expansive, as you might have guessed! In fact, prices for them haven't been that high since 2005... Just before the close of Friday, you could buy iron butterflies for around 88/64 where as lately the price is more around 78/64... One thing not to forget is that we have slightly more days this month that the norm so this also helps to bump the price a bit.

T-Bond trading comment (September 28, 2007)


Few, what a day we had ! We opened this morning on the upside, licking the
112 level and boom in the afternoon we went as low as 110-26 before recovering to the 111-11 level which was the opening price! The daily movement does not give a fair idea of the intraday movements... This morning we ticked higher on the back of continued fears about the economy and month end. We had several economic indicators in the morning but they all came around their expected values and did not create any major turbulence. After the news we started to drift slowly lower and we were looking to close the day around 111-22 but that was not to happen.

In the early afternoon, the US Dollar started to weaken against most currencies and started to spiral down prettty fast. Since the US basket and the Bonds are positively correlated, the bond just started to puke on volume. People were dumping treasuries on the fact that if US is getting dumped, that means that foreigners are probably selling their investment and you don't want to be left holding the poop bag alone. The slide was maybe a bit exagerated and we started to win back part of the loss. We closed the day unchanged... Again... We've had a lot of compression days lately, when the market is going to move one way or the other it might be very abrupt.

Next week is the first week of October, so this means that we have NFP! In addition to that we of course have ADP, but also the ISM indexes and pending home sales. Also with the rumour mill spinning like crazy we might get some added volatility. The last one I heard today was that the BOE was going to have an emergency meeting to cut rates....

9/25/2007

T-Bond trading comment (September 25, 2007)

We broke overnight the 111-00 resistance we had been toying with for the past few days but closed below it on steepner trades ! We opened higher this morning and broke through the 111-00 resistance overnight while Germany had disappointing economic numbers and the rest of the world was fretting about increased risk about the slowing of the economy. After that the T-bond started to slip as well as the rest of fixed income as equities were opening on a strong foot. The T-Bond fell more than its fair share, even breaking its new 111-00 support as people are still rooting for a more pronounced economic slowdown and thus a steepning of the curve. Sell the long end and buy the short end.

Right now, the feeling in the market is very mixed. Traders are trying to balance in their mind and their book two fears. On one hand we have inflation risks that are increasing with higher oil prices, lower Fed rates and China's overheated economy and on the other hand we have economic slowdown... Which one is the most probable and the scariest? This is the question a lot of the street is asking.

9/24/2007

Looking at the options

Right now, trying to profit from the actual instability through an ATM straddle is pretty expensive. Friday morning it was running at about 140/64. Today this is a bit better but nothing to call your grand mother.

So you might just want to wait until the beginning of October, next Monday, to put on iron
butterflies. These butterflies performed in a stellar way, especially if you sold the most expensive option on September 7th, bringing home a bit less than 2 bucks in. Altough, past performance is no indication for the future and this is especially true for October. Looking at the two preceding years, October has always been a rough month for these strategies....

T-Bond trading comment (September 24, 2007)

We are about flat on the day, but this is not a fair description of the day. We arrived this morning at the office with the T-Bond loosing half a buck overnight. As soon as everybody was fully seated at their desk, we started to run higher as market participants had increased fear of an economic slowdown in the US. In accordance to that, equities were hit, thus rejecting for now, higher highs . It is worth noting that we have been in this dynamic since early June 07. Bear, here we come ???

We are slightly up for the day, but we still haven't validated a bullish configuration. As long as we are at the 111/111-04 level, we will be in a corrective move.

Today we didn't have any economic news, but tomorrow we are up for S&P/CS index (loss expected here), Richmond Fed Index (another loss there too) and home sales ( guess what? another loss too!). If the news come out on the weak side we might very well end our corrective move.

9/23/2007

The week ahead

Next week will be rather calm in terms of economic news. Wednesday, we have durable good orders and Thursday, we have GDP. Both these numbers will be looked at in an attempt to define how much is the economy slowing. Is it a recession slowdown or just a little pause slowing?

Also next Friday is the last day of the month, so we could see some buying activity with index extension...

9/21/2007

T-Bond trading comment (September 21, 2007)

After a week of heavy selling, we saw some good short covering to close the week. The market opened on a strong foot in the early morning but met some resistance when Warsh talked about inflation. This quickly sent the market to yesterday's electronic closing at 110-01 but speculators were unable to break through it as some strong bids came in to lift the market. At that point buyers just clicked in and from there on we had some smooth sailing to the upside.

The question right now is: Was this just a slight short covering for the week-end before restarting to the downside next week or are we retracing a bigger part of the late downslide ? Right now, there is no reason to root for a bigger retracement as long as we haven't taken out the 111-00 level so this means it looks that there is more room to the downside.

Today was expiration day for options, people who bought there iron butterfly on the first day and sold the most expensive option of the butterfly on September 7 have cleared a hefty profit....

9/20/2007

T-Bond trading comment (September 20, 2007)


Well the post Fed bull run we had in equities came to an end today but that was not the end for our bear spell in the T-Bond as the market puked another buck and half. Players are just putting more and more steepners on and by doing so kill the long bond. An aggravating factor to this bleeding is several rumours churning around that Asian and Middle-East countries are looking to dump their US holdings. If this turns out to be true, the bleeding will become an hemorrhage.... The news first it the trading desks with the fact that Saudi Arabia might stop its peg to the US dollars. If they do that, the next logical step is to dump their US holdings... So this could become ugly...


Today, the only way to be was to be short. Just take about any point between 7h00 AM and 16h40 PM and you made money on the downside.... This was one of the rare days lately where the long bond and the equities had a strong positive correlation.


Now the question is where we are going from here ? The answer is not very easy. We are entering the autumn months and generally it is pretty hard to find lasting trends at that time of the year. 2006 was more of an exception than the norm. Technically, we are bearish but we have lost four bucks in two weeks so a little respite could also be possible especially since trends usually stop around this time of the year and the markets starts oscillating until mid January. My personal opinion would be to test the downside if you are not already short but most importantly put a at the money straddle with a momentum exit.... This couls yield potentially interesting results...

9/19/2007

T-Bond trading comment (September 19, 2007)

We confirmed the bearish strategy we outlined yesterday and that was simmering for the past week. Early last night, we opened below the 112-16 level and from there on, we just went lower. With equities on the strong side the market tanked more than a buck until 11h30. This is when equities stopped climbing and started to give some ground. From there, we partially reversed the loss on the T-bond but still, the long bond is bleeding lot more than its shorter comparses...

The reasons behind this fall are inflation and slowing economy according to me. We're just finished with inflation reports and yes they were not very scary at first look. But dig in deeper and what do we see? Inflation ramping up in food, medical services and services. This kind of inflation is harder to kill of than energy inflation and that is not good for a 30 years bond as you might expect. The second pressuring factor on the T-bond is the belief that the economy is going to slow and maybe enter in recession. This factor coupled to a Fed rate cut and you obtain curve steepning. How do you put a curve steepner? you sell the long end and buy the short one. In addition to these fundamental reasons we were also running out of steam on our bull summer bull run.

We do not have any other major economic release for the week. Friday is option maturity day so we might stick to the 112 figure which was where we were on the first trading day of september

9/18/2007

T-Bond trading comment (September 18, 2007)


Well the FOMC came and went and where are we standing at the bell ? Just over the 112-16 level... Granted we went to see much lower post FOMC, but this problem was only in the T-Bond. Notes went barely down before going much higher and firmly rejecting the breach of the 109-20/22 support. Now the only big news until the end of the week is the CPI tomorrow morning so this could smell foul for vega buyers as the options are expiring on Friday. The real question now, is were are we headed for the near future? The answer to this question may be lying on an intraday chart. If you look at a multiple intradays chart you will notice that we have a nice descending triangle. The horizontal line, forged by the lows, lies at 112-16 and the descending line is made by lower highs (114-02, 113-16, 113-06...). This picture is pretty compelling and indicates that we have more room to the downside than the upside...


We opened the market with, again, the exact same pattern as the last 4 days. We opened trying to challenge new highs and quickly failed before quickly retracing our steps towards the 112-16 level. From there on, we drifted higher like the other days. Altought this time we went lower as the market prepared itself for the Fed.

As you might have seen (duh !), the Fed lowered its rate by 50 bps, what the market was princing. Market participants are still haggling on the size of the cut. Certain people think the Fed had no reason to cut while others thought the opposite. Honestly, I do not care if they were right or not, the only thing I think about is that this move is inflationary... By the way, Greenspan thinks that our next big beast is long term inflation....

9/17/2007

T-Bond trading comment (September 17, 2007)


Very low volume in front of the Fed tomorrow. We had, as we might have expeected, a very uneventful day. Like we did on Thursday and Friday, we tested supports in the morning before bouncing up after failing on the 112-16 level. This level has to be put in parallel with the level of
109-20/22 on the T-note. If we break that, we are ending the bull run started inJune. Otherwise, we stay in our double bottom scenario we outlined in our September 1st post.

Like the last two days, we opened the market with some half hearted runs to the upside but each run was met with a wave of selling. This pattern broke off after the Empire Manufacturing Index. We went to see the 113 level on the number and then plunged towards the lows of 112-16. The descent was pretty much straighforward but the 112-16 held on very strong bidding. After that, we started to go higher on low volume. Now the next hurdle is in tomorrow afternoon. In the meantime people will want to flat their positions ( if they still have some!) before the FED. So don't expect much action until then.

Tomorrow in addition to the FED, we have PPI. On our radar, are also Q3 results from Wall Street in the US that starts off tomorrow... It will be interesting to look at them. People expect to see a quarter as bad as in 2001.... Lastly don't forget that this week is option expiration week.

9/15/2007

The week ahead

Next week, Monday and Friday are dead or almost! But that is about it. We have PPI/CPI numbers on Tuesay and Wednesday. These numbers will be important as we will see if inflation continues to dampen or not. In that line of thinking, there has been much talking about food inflation and Chinese inflation. Lots of people say that China does not says thruth about their inflation. If both of the preceding assumptions turns out to be true (higher food and Chinese inflation) we could see the market tumble by a fair amount.

But lets not fret about such rubbish for now, because all this is dwarfed by tueday's FOMC rate decision. A cut is more than widely accepted but much talking and hagglingis going on about the size of the cut. 25 or 50 bps . Right now, market probabilities are slightly in favor of the 50 bps cut (46.4% against 45.7%). Another interesting possibility would be a 25bps cut in the overnight rate but a 50 bps cut in the discount rate. This might be a very effective way to lower the Libor without lowering the overnight rate by too much.

9/14/2007

T-Bond trading comment (September 14, 2007)


Again we tested higher levels and again we failed and went lower to try important support levels witout breaking them decisively. We opened to the upside this morning on bad news from Europe. Stocks were getting hit after Northern Rock announced it had liquidity problems. This pushed the T-Bonds higher toward the 113 line. 8h30, the durable good orders came out on the weat side and propulsed the market higher still. We were going for the 113-17 level on which we failed yesterday, but before arriving there UoM came out as expected and the equities decided there was no more credit crisis for the time bieng and shot upward. This killed our little rally in the blink of an eye. In 45 minutes we lost almost a buck to come and sit on yesterday's support just below 112-2. After that, the market got stuck between 112-16/22 on low volumes and looked like it was going to stay there, but the market initiated a little rally for the 3 o'clock close and went to 112-27. A possible explanation for this, is market participants covering their shorts for the week-end in case any bad happens.


The credit/liquidity crisi is looking a bit beter right now. Countrywide got more financing, GMAC too. Market participants are depricing risk which sends credit and stocks indexes back to more normal bahaviors and Libor is coming back. That is all well, but I find myself surprised to hear everybody around me saying this is merely the calm before the hurricane... Guess we will see.


By the way did you look at a S&P500 chart lately?

9/12/2007

T-Bond trading comment (September 12, 2007)

We are in a trading range ! This morning we tried the upside of the zone and we failed to overpass the 114-5 area. From there on, we traced lower while stocks were going higher and several market players were cashing in on long positions. The fall was pretty straightforward with a little battle around 113-20/22 (yesterday's support area). We went all the way down to the support we designed on Monday morning at 113-8/10. After that we were getting late in the morning and liquidity died out while we kept bouncing off the support area.

Mid trend followers had another nice day after yesterday as the market gave very clear bearish signal. Talking about that, the best time of the year to do this kind of trading is in the second part of the year and 2007 is no exception to this rule. Of course for this to work, you wait for the liquidity to come back after the summer!

If the 113-10 level holds, these last two days could very well be a little breather before going higher. Otherwise, the huge bull run we started around 106-20 is coming to an end... We must not forget that the usual summer run generally dies out at the end of September/ beginning of October, when we have one.

Tomorrow, we have claims, 10y reopening and the montlhy budget statement at 2.

9/11/2007

T-Bond trading comment (September 11, 2007)


We had a breathing day today, after two days of heavy trading to the upside. Liquidity was not very good all day. We opened this morning with bearish intentions but this was quashed at 113-21 (This level would actually turn out to be a support for the rest of the day). Afterwards, we drifted aimlessly while waiting for Bernanke. His speech had a bullish impact on the market but he basically just repeated what has already been said for the last few weeks. Like yesterday, the upswing got stuffed at 114-05. From there on, we started to go lower on very low volume. Again we touched the 113-21 level before bouncing back up to the 113-27 area.

The behavior of the T-Bond has been a bit peculiar over the last two days.... It is as if some heavy curve flatners were put on and the market rather well supported in comparison of the T-Notes 5 and 10y. The problem is that we are not hearing anything about curve flatners being put on. Another alley is that pension funds are buying longs bonds to match their maturity and getting the hell out of riskier investment while the loss is not too nasty.

On the news front, we had a rather ok day. Equities in Europe and Asia showed healthy gains and the US followed the same path when it was its turn to play. Credit indexes (Itraxx and CDX) stayed flat to a bit tighter and the Libor tightened again ! We will see if the market can sustain good news/momentum for two days in a row...

Talking about the current liquidity crisis, we just brushed the positive side of the picture so let's dwell a bit on the darker side to be fair. On the negative side, we still have serious problems inthe commercial paper market (ABCP included). It is rumoured that up to 700 bln comes to maturity this week. This could put a lot of pressure on the Libor as well as on the balance sheets of banks that could find themselves in the obligation of taking some off the balance sheet items on their balance sheet... Hello funding/lending activities. The Libor US might be fixing lower but have you looked at the Libor CAD ? Not pretty. Finally, housing sectors is still underpressure with Countrywide rumoured to be in need of more cash after Bank of America's infusion. In addition to that, we had our first subprime casualty in the UK where Victoria Mortgage announced it is going into administration. If the subprime crisis transports itself to Europe, it could get really nasty...

By the way, our elasticity index seems to be getting a bit overextended so it would not be surprising to see the T-bond head lower... But let's wait and see for now...

9/10/2007

T-Bond trading comment (September 10, 2007)


We had a bit of job left to the upside after friday's bull rally and we did it today! We are now at the top of the 113-16 / 114 resistance zone and looking like wanting to take a breather after 2 bucks in 2 days. On the upside, the next big zone is the 114-20 / 115 area. If we break this, we validate a double bottom configuration with an ultimate potential around 124. We opened the day about flat compared to Friday's evening and from there we started to bid the market. Trend followers will have had a nice day as the market broke very nicely. Short gamma players, will have ran all day to hedge their books as well as market makers since it was a one way street.

People are running scared right now and are not necessarily logical.The market is like a herd of mad cows not thinking and moving all in the same direction. People are fearing a full blown recession after friday's weak NFP, but it is maybe a bit early to be that gloomy.

The rest of the week will be quite ligth in terms of economic numbers with only retail sales and import prices on Friday.

9/07/2007

T-Bond trading comment (September 07, 2007)


With today's NFP, we confirmed the bullish scenario for September with a 1+$ jump. We opened this morning with a slight upward pressure after holding the 112 support line yesterday. Liquidity was non-existant until 8h31 as the market was waiting for the NFP. Just before the NFP, the market got lifted for a couple of hundreds. Right after the number came out at -4 k. Instantly, we were almost a buck higher. Peoples with an explosion position waiting in their tradebook were rewarded. With the market pricing a rate cut for September 18th, we climbed higher & higher for the rest of the day.


Speaking of the Fed, if they cut the rates at their next meeting, they will be the only ones to do so. BoC, BOE and ECB all stayed put when their turn came by.


The market may be getting a bit ahead of himself right now. Why? If we dig a bit in today's number, you will notice that the major (if not almost all) part of the loss came from the teenager segment. The most probable hypothesis to explain that is not massive firing of incompetent youth ( we would have heard of it) but simply normal blokes heading back to school spend their hard earned summer bucks. If this turns out to be true, the market could come back in the next weeks.


In that line of thoughts, for the ones of you who bought iron butterflies at the beginning of the month should maybe looking at selling their 112 october call. Why? Do your own homework!

Good week-end

9/06/2007

T-Bond trading comment (September 06, 2007)


Yesterday, we put our bull hat and today we had our bear outfits.... Lately the market has been totally unsure of which way to go... We are oscillating between 110 and 112. Volatility buyers are bleeding while the sellers have been feasting for the past month. Even if the volatility has been huge on an intraday basis, we are not moving on a daily basis.

We opened the day virtually unchanged compared to the preceding close. After testing lows overnight, the market bounced up and actually looked like it was going to make new highs, but pretty soon it became clear that the 112-10/11 was going to contain at least for now bullish advances. At 8h30, we had claims, unit labor cost and productivity. The data was maybe a bit on the bullish side but after a small dip, we again tried to take out the preceding highs but failed. Market players though, if we can't go to the upside let's try the downside ! But bids were waiting in the corner and they came out at 112-01 and eventually moved to 03, 05 and 07. Again we failed to the upside and during lunch time, the formerly big bids were shot dead in seven minutes on 16k traded. After that the market died out and we broke the 112 line before coming back and hugging it for the end of day picture.

A point to keep in mind is that even if we have crossed to the upside the 112 line on the T-bond, the resistance area on the T-note hasn't been broken... Since both market are inter-related, we should keep a sharp eye on that. The resistance area is the 109-20/110-00 zone.

Tomorrow, we have NFP data!!! The ADP index was a bit low, but the correlation between both indexes has not been terrific up to date. All the economic numbers have been on the strong side lately, we will see if the trend continue tomorrow.

9/05/2007

9/04/2007

T-Bond trading comment (September 04, 2007)


First day of September and I don't think everybody was back... We had a relatively low liquidity market and small volume throughout the day. I remember at one point this morning just before 11h00, the market was only 6000 by 6500 which is a bit small. Even if the market went down like crazy this morning we remained almost unchanged compared to the settle of Friday. We are only down 3/32 on the day.

We opened this morning with some ambitions of testing the 112 line. We failed again at 111-29. Each time we fail, we inrease the probability that this resistance will hold in the future so we must keep in mind our bearish monthly scenario. After this unsuccesful challenge the market started to nose dive, we lost 20 ticks in the space of 90 minutes. At one point I tought we were going for one big point but in the end we settled for much less. This movement was spurred by strong equity markets as well as a sense that we are not yet deep in troubles. Just before 11h00 we encountered some aggressive bidding and a small base formed around 111-07/08. With the RSI hyper-compressed and stock markets starting to stall, we retraced part of the dive by succesive steps that continued for the rest of the day.

Tomorrow, we have the Beige Book as well as the ADP index and pending home sales. Home sales are not looking good but the ADP index is showing a healthy 80k survey. Also at 9h00, we will have the Bank of Canada rate decision. It will be interesting to see how they cope with the current market conditions.